Tracking key trends in the pet accessories market
A new survey finds that most pet parents buy these kinds of items a few times a year, with spending shaped by changing budgets and shifting shopping habits.
The accessories category has now become a key expense for many owners, so they want to ensure quality items that are safe for their pets. And online marketplaces – including major e-commerce platforms and discount sites – have become the primary purchasing channel.
Tracking regional variation
A new survey by Yummypets, powered by Loop, and PETS International among 2,708 pet owners in Australia, Brazil, Canada, France, Mexico, the UK and the US shows that most consumers purchase accessories a few times a year. Their spending tends to be in the middle range, although some pet owners do make higher-priced purchases.
Beyond reporting on all the general trends, the data also highlights the specifics of the purchasing journey in these seven countries, uncovering some interesting similarities as well as differences.
Top dog accessories
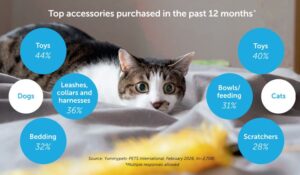
Toys were the most commonly purchased accessory among both dog and cat owners over the past 12 months. While the overall share was similar, slightly more owners bought toys for their dogs (44%) than they did for their cats (40%).
Other accessories, however, show quite distinct variations depending on the type of pet. Among dog owners, around one in three respondents (36%) gave leashes, collars and harnesses as the second most purchased accessory. Items like these were mentioned more among respondents in Mexico (45%) and Australia (43%) compared to other pet owners surveyed.
Bedding items such as blankets and beds (32%), and grooming apparel including brushes and combs (31%) completed the top four most purchased accessories for dog owners, with the latter found to be more popular in Brazil (40%) and Mexico (39%).
Items for felines
For cats, on the other hand, there were more purchases of bowls and feeding accessories (31%), scratchers (28%) and grooming items, especially brushes and nail cutters (24%). A key finding for the global cat accessories marketwas the particularly high level of activity in the US.
Cat owners in the US surpass the global average purchasing rates in no less than six categories. This includes toys (50%), scratchers (36%), cat trees and climbing furniture (28%), and bedding items (26%). The latter also saw a notable uptake in the UK (27%).
Deciding factors
There are two factors that most influence the choice of accessories. The first is pet safety, mentioned by 72% of owners overall, and particularly significant in Brazil (78%), France and the UK (both at 76%), and Canada (75%).
Respondents also consider product quality and durability very important (71%) – US consumers even more so (76%). Pet parents also look at price when choosing a product (60%), and price sensitivity is slightly higher in Brazil (65%) and Australia (64%), followed by the US and Canada at 63%.
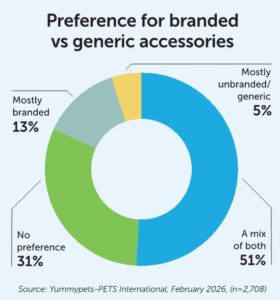
Other product characteristics rank lower among owner priorities, such as design or aesthetics (23%), reviews and ratings (23%), sustainability or eco-friendly materials (17%) and brand reputation (9%). The survey allowed each respondent to choose the three aspects that matter most to them.
Although brand is the lowest priority when choosing an accessory, more than half of the pet owners (51%) say they buy a mix of branded and generic items. But only 13% opt for mostly branded products, while 5% prefer mostly unbranded. Almost a third (31%) declare no preference in that regard.
Frequent vs infrequent shoppers
Overall, respondents to the Yummypets and PETS International survey see accessories as occasional buys, which is reflected in how infrequently they purchase them.
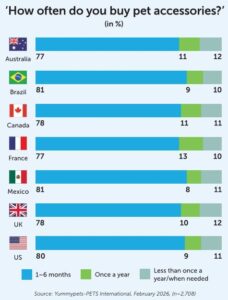
That said, there are still a significant number of pet owners (41%) who regard these items as essential and shop for them several times a year. While there’s no major difference between countries overall, France and Mexico do have a slightly higher group (44%) in this category.
Frequent shoppers are the second largest group, as 38% of respondents make purchases more than once every three months. This behavior is more frequent in Brazil and Canada (both at 41%), and less frequent in France, where just one in three pet owners shop for accessories more often during the year.
Purchasing accessories just once a year is the case among 10% of the respondents surveyed. Another 3% do this even less than once a year. And an additional 8% say they make a purchase only when replacement is absolutely necessary.
Gifts for special occasions
The data reflects how pet parents around the world view accessory purchasing, as 51% of them say they think of these items as ‘an occasional treat’ for their pet. That is even more the case in France (59%), as well as Brazil and Mexico (both at 56%).
On the other hand, 44% of the respondents see pet accessories as ‘a needs-based purchase’, with even more owners stating this in Australia (57%), and in Canada and the UK (50%). An interesting marketing opportunity for the industry could be the 5% of pet owners who classify this kind of item as a ‘special occasion purchase’.
Spending patterns
When it comes to yearly spending, the majority of respondents (64%) fall within the middle range. The biggest group (35%) indicates spending between $30-$75 (€26-€65) per year on accessories. A similar percentage (29%) reserves higher amounts for these purchases, between $75-$150 (€65-€131).
The data also shows a positive trend: globally, more respondents are spending at the higher than at the lower end. As much as 14% of pet parents say they spend $150-$300 (€131-€262), with one in 10 purchasing more than $300 (€262) worth of accessories a year for their furry friends. At the other end of the scale are those spending less than $30 (€26) – 13% of all respondents globally.
Most of the countries in the survey follow the same spending pattern, particularly Brazil, France, Mexico and the UK. The US and Australia have the highest percentages of high spenders, while Canada has the largest share of owners spending at the low end.
Budget allocation
Apart from absolute figures, the survey reveals how much of the owner’s pet care budget (which includes nutrition, grooming, veterinary care and other needs) is dedicated to accessories and enrichment products. For almost half of the pet owners (49%), this category represents 10-25% of their average spending on pet care. In Mexico, more owners budget this amount (56%).
One in four owners dedicate less than 10% of their budget to these products, especially in Brazil (34%) and France (28%). Fewer than one in five respondents (17%) allocate 26-50% of their pet care budget to accessory purchases, while 7% reserve more than 51% for this category.
Popular marketplaces
Marketplaces such as Amazon are central to pet accessory purchases, with two-thirds of respondents (66%) reporting that they usually shop there. Reliance is highest in the US (85%) and Mexico (73%), while in France (52%) this channel still has potential.
The popularity of e-commerce players also extends to discount marketplaces based in Asia (Temu, AliExpress and Shopee) and the US (Wish). These channels are used by 30% of the survey respondents, highlighting the growing role of lower-cost online platforms in the category. Brazilians stand out with almost twice as many owners (55%) opting for these sites than the global average. On the other side, the penetration of this channel among pet parents in the US, Canada and France is only around 20%.
Amazon is increasingly important
Eight out of 10 respondents stated that they had already purchased these types of products from Amazon. Overall, 28% said they had increased their purchases on the platform in the past 12 months, indicating that it can become more important to them over time.
Frequency of purchase differs tremendously, depending on the country. Mexican, US and UK pet parents make up the majority of regular buyers. At the other end of the scale are the larger numbers of Brazilians and Australians who have never bought from Amazon.
Looking at the numbers of times that purchases are made on this platform, there are some countries that stand out. While 28% of the respondents report six times or more, almost one in four Canadian (36%) and UK (38%) pet owners have done so, with US buyers on top, at 47%.
Discounter potential
Unlike Amazon, which is already well-established for regular accessory purchases, discount marketplaces seem to be on the rise. Among the respondents, the distribution between those who have and haven’t bought from this type of channel is exactly the same: 50/50. But the nuances in the responses give hints about how this may evolve.
The findings reveal that 14% of those who have never bought from one of these marketplaces say they are aware of the possibility, but don’t trust them. Another 11% say they have never done so, but are willing to try.
Meanwhile, 25% simply said “no” to the question, and didn’t point to a reason why they wouldn’t buy there or for their unwillingness to change their minds.
Of the respondents who have bought on discount marketplaces, most (26%) say they did so occasionally. Next come those who have tried this once (13%) and, finally, the regular shoppers (11%). There is a marked difference between the countries surveyed.
Canada has the highest share of respondents (31%) who simply haven’t ever bought from these platforms. The US has both a higher percentage of owners who are willing to try (16%) and those who don’t trust them (22%). Meanwhile, the French share the same level of distrust as the Americans (22%).
Brazil, on the other hand, leads both the occasional (38%) and regular (20%) shopper segments. And Mexico has the highest share of respondents who have tried discount marketplaces only once (19%). Australia and the UK display purchasing behavior at discounters similar to the average.
Accessory purchasing through these channels is, in general, quite irregular, perhaps representing experimentation. Most pet owners had purchased something from one of these marketplaces only a few times (2-5). Just 13% of them did so more frequently, 9% of which reported several times (6-10) and 4% many times (more than 10).
Rationale for buying online
Shoppers who choose to buy accessories online instead of in physical stores do so primarily because of lower prices, which is a reality for 60% of respondents. There are more consumers interested in cheaper items in Brazil, Australia, Canada and the US.
After that, two reasons were the most relevant for the same number of consumers (52%): the appeal of convenience and home delivery, as well as promotions and discounts. While convenience was more often a reason for Canadians and Americans, discounts were much more important for Brazilians. Driven primarily by responses from French owners (52%), the fourth reason for buying online was a wider product assortment (41% overall).
At the other end of the scale, logically, it is higher prices, inconvenient location or opening hours, a limited assortment and simply better online alternatives that were given as the main reasons that prevent consumers from buying more pet accessories in physical pet stores.
Traditional retail
While online dominates, specialist stores do retain an important part of the sales in the category. More than half (54%) of respondents to the survey opt for large pet retail chains. A further 49% go to independent pet stores when they need accessories for their pets.
Looking at it from a regional perspective, while large chains are a lot more popular in Australia (69%) and the US (63%), Brazilians and Canadians are the ones who most frequently visit independent pet shops (60% and 57% respectively).
Supermarkets are the fourth most important retail channel for the category, mentioned by four in 10 owners (41%). They are mainly popular in Mexico (61%) and the UK (55%). The number of Canadians who buy accessories in a supermarket (17%) is much lower than the average. And although only mentioned by 11% of respondents overall, hardware and garden stores are significantly more popular in France, with 27% of the pet owners shopping for accessories there.
Spending outlook
Overall, 69% of the respondents expect to maintain their spending on accessories over the next 12 months. This tendency is stronger among French and Canadian owners, with more than 75% of respondents from both countries saying this was their intention.
Those who expect to buy more next year are more numerous than those saying they’ll spend less, as roughly one in five pet parents (19%) say they’ll probably spend more in the future, while just 5% plan to reduce their spending on accessories. Brazilian owners (31%), lead on the expected increase in expenses regarding accessories, followed by Australians (22%) and Mexicans plus Americans, both at 21%.
The pet owners were asked whether different sources of information have an effect on what they buy. In general, it’s family and friends who have the most influence, with 40% saying this is the case, followed by in-store information and staff (34%) and social media (20%). Just 14% say that traditional advertising has a strong or very strong effect.
Influences on purchasing decisions
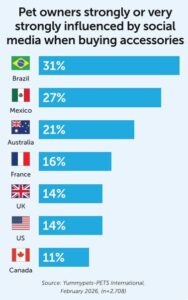
There are interesting regional differences. In Brazil and Mexico, there’s even more influence from family and friends (47%) plus information received in-store (40% and 47%). The effect of social media is also greater in these two countries, at 31% in Brazil and 27% in Mexico. Canadians seem be the least influenced by both traditional advertising, at just 7%, and social media (11%).
As the accessory market develops and smart products are increasingly on offer, consumers may well look for even more expert advice before purchasing. How they get this information, and the demographic differences between the sources used, will continue to be a useful part of future consumer research.
Share this story: