Amazon captures nearly a quarter of US pet sales through first-party vendors
Data shared with GlobalPETS shows that sales in the country have risen by nearly a third, while more than 2,000 brands compete in some subcategories.
First-party (1P) vendors selling pet products directly to Amazon account for 23.4% of the monthly average revenue for the pet category on the platform in the US.
This represents a monthly income of $322 million (€279M), according to data from the market research and data analytics platform SmartScout. The figure is based on sales over 12 months from 11 August 2025 to 11 August 2026.
In line with FMCG categories
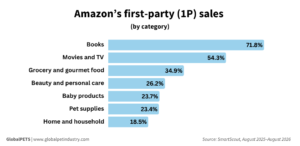
The percentage ranks the pet category 13th overall with the largest share of 1P sales of the 29 analyzed. Amazon devices and accessories dominate the list (88.5%), followed by classification and ranks (81%), books (71.8%), movies and TV (54.3%), and CDs and vinyl (35.9%).
But the pet figure is much more in line with other fast-moving consumer goods (FMCG) categories, for example, beauty and personal care (26.2%), baby products (23.7%) and home and household (18.5%).
Category nuances
According to Scott Needham, SmartScout CEO, some categories such as dog food are “cost-prohibitive” for third-party (3P) sales on the platform. “The different logistic price points offered for oversized Amazon vendors really push that category to be 1P,” he tells GlobalPETS.
As Amazon buys and owns the inventory itself, it controls the logistics network and negotiates shipping costs more efficiently.
For instance, in dog food, Amazon sales represent 78.6% of total revenue, a percentage that jumps to 89% in cat food, 84.5% in treats and 100% in pet insect supplies. 3P sellers, on the other hand, dominate horse, bird and amphibian food and health supplies.
While 1P vendors sell directly to Amazon, 3P sellers use it as a platform to retail their products directly to consumers. Usually, 1P sellers are consolidated players in more mature markets, while 3P are smaller, more independent players.
According to Needham, annual growth of 1P pet brands is 34%, while the rate for 3P pet brands is 108%.
Sales from China
Competitive dynamics also vary across categories. Needham argues that electronics, home and kitchen, and apparel have become increasingly targeted by Chinese sellers, whereas beauty, grocery, health and wellness and parts of the pet category have so far proved to be more resilient.
In pet, Chinese sellers represent 70.3% of apparel and accessories for dogs, 60.6% of crate, house and enclosure sales, and 52% of doors, gates and ramps. In the cat subcategory, these players represent 80.3% of revenue for apparel, 67.3% of beds and furniture, and 66.1% of collars, harnesses and leashes.
Other markets
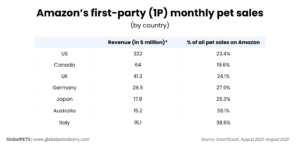
Outside the US, Canada has the largest 1P revenue for pet supplies on the platform, selling $64 million (€55.5M) per month on average. The figure corresponds to 19.6% of all pet sales on Amazon there.
This is followed by the UK, with $41.3 million (€35.8M) monthly revenue. Amazon sales represent 24.1% of the category sales in the country.
Germany is the third market by 1P sales, with monthly sales of $26.5 million (€23M). However, 1P sales are more representative in the German market at 27.9%.
Italy, Spain and Australia have the highest participation of 1P revenue in the pet category, all above 38%. However, this translates into different figures.
In Australia, Amazon sales amount to $15.2 million (€13.2M) monthly, very close to the sales registered in Italy of $15.1 million (€13.1M). Spain sells $8.4 million (€7.3M) monthly.
General sales increase in the US
Total sales – from both Amazon and direct sellers – in the US have grown 32.6% in the past 12 months to roughly $1.4 billion monthly (€1.2B), with more than 54 million units sold.
This revenue places the sector as the 10th most profitable among the 29 measured by SmartScout, behind a top five of health and household; home and kitchen; clothing, shoes and jewelry; electronics; and beauty and personal care.
The top 10 is completed by patio, lawn and garden; tools and home improvement; sport and outdoors; and grocery and gourmet food.
Dogs drive the highest revenue
Overall, Amazon trends mirror the broader market. For instance, dog products still dominate monthly revenue, adding up to $877.4 million (€768M) in the period from 21 July 2025 to 21 July 2026.
This figure is more than double the monthly numbers for cats, at $402.2 million (€352M), and is 20 times the monthly sales of fish and aquatic pets supplies, the third largest category.
But other segments have registered a higher year-over-year (YoY) growth. The average of 12-month growth rates for individual subcategories points to terrarium as the sector with the highest rise (51%), followed by cat (48%), bird (32%), aquarium (28%), small animals (21%) and dog (16%).
Brands and market concentration
There is greater competition in categories that are not necessarily the highest revenue generators. For example, basic dog collars are the 34th largest subcategory in revenue but have the highest number of brands selling products: more than 2,000.
Dog chew toys follow the same trend: more than 1,840 brands compete in this subcategory, which generates $10.3 million (€9M) monthly (occupying the 25th spot in terms of subgroup).
Even more impressive is the market for funeral and memorial items for dogs, in which 1,800 brands operate with monthly revenues of almost $2 million (€1.7M), turning it into the 136th subgroup in terms of sales.
But categories with more impressive sales, such as dog beds (sixth largest) and dog treat cookies, biscuits and snacks (the top seller), are also in the top 10 most competitive, with 1,719 and 1,383 brands, respectively.
The subcategories with the fewest players operating on the platform in the segment include reptile and amphibian supplies; filters and pumps; dog kennels and lick mats; and frozen and air-dried cat food.
The data highlights a market with room for both established suppliers and emerging brands as sales continue to increase across the board.
Share this story:
One click prioritizes GlobalPETS in your search results and AI answers.