US: Pet care emerges as one of the most digital grocery categories

The category ranks third among grocery categories for online penetration, behind health, beauty and baby care.
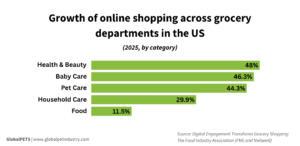
Nearly half (44.3%) of US pet care sales in 2025 were made online, with digital revenue rising 9.9% year over year, according to a report by NielsenIQ and the Food Industry Association (FMI). In-store sales fell 2.2% last year.
Pet care is one of the grocery categories with the highest share of online sales, ranking third behind health and beauty (48%) and baby care (46.3%).
However, retail channel preferences vary by segment. Pet food purchases remain predominantly in-store, accounting for 64.4% of sales, compared to 35.6% online. In contrast, pet supplies lean toward e-commerce, with 60.7% of sales made online and 39.3% in-store.
E-commerce activity
Across all categories of grocery retail in e-commerce, pet stores account for 2.4% of total value share in the US, down 0.3 percentage points (p.p.) YoY. Amazon dominates online sales with a 42.2% share, followed by mass retailers (18.9%) and grocery stores (17.5%).
Despite this, pet stores are gaining traction among higher-income households. Spending from consumers earning more than $150,000 (€128,000) annually rose 10% YoY, even as their overall share slipped slightly by 0.1 p.p.
On the other hand, purchases from lower-income households – under $50,000 annually (€42,600) – declined by 7% YoY, indicating growing price sensitivity within the channel.
The NielsenIQ- FMI report points out that this shift comes as the e-commerce landscape becomes increasingly competitive, with consumers leaning toward more affordable and convenient options.
For instance, pet supplies were among the top categories on TikTok Shop – an emerging e-commerce platform – ranking fifth and generating $320.3 million (€273M) in sales in 2025.
Omnichannel performance
Overall, 94% of American consumers who purchased grocery items shopped both online and in-store in 2025, making at least one purchase via each channel.
Consumers in the pet care category exhibit dynamic purchasing habits across retail channels. For instance, items bought per occasion (per trip or pet online transaction) in-store are higher than online, at 3.1 and 2.4 items, respectively.
Meanwhile, the dollar value per occasion is much higher for online shopping than for in-store, at $36.48 (€31.13) and $22.33 (€19.05), respectively. “To some extent, this is a result of e-commerce economics. Online price points are often higher with larger pack sizes,” the report analyzes.
Retailer response
In response to the growth of e-commerce, players are adapting. In terms of fulfillment strategies, the FMI found that most US retailers now offer store pickup, either curbside (78%) or inside (45%), while some offer pickup at another location (2%).
In addition, many retailers offer door-to-door delivery, with the majority (76%) using third-party or on-demand services, while 27% use their own employees.
More than 8 in 10 retailers (83%) use technology to personalize or customize marketing or shopping experiences, both online and in-store.
Market outlook
NielsenIQ estimates that between 2026 and 2028, total US omnichannel grocery sales will grow at a 3.1% compound annual growth rate (CAGR), supported by online sales channels, which are expected to grow at an 11.57% CAGR. Meanwhile, in-store growth is expected to remain modest at 0.62%.
Online grocery sales in the US are expected to reach $363 billion (€308B) in 2026, growing to $452 billion (€385B) by 2028.
According to the market research firm, digital channels will capture most incremental dollars, making investments in search visibility, product content, seamless fulfillment and a frictionless customer experience essential to winning in a channel-fluid shopper landscape.
“In-store can complement these digital journeys by enabling shoppers to view and become familiar with products, ultimately leading to sales across channels,” it concludes.
Share this story: