The enrichment products that are now everyday essentials
Exclusive data reveals how owners across seven markets are making purchases with a view to supporting the mental wellbeing, physical activity and overall health of their cats and dogs.
Whether it’s for stimulating their minds or exercising their bodies, toys are found in most homes with pets. In fact, a survey conducted by Yummypets, powered by Loop, and PETS International found that just 1% of cat owners and 2% of dog owners don’t buy any of these items.
Widespread use
Based on responses from 2,708 pet owners across Australia, Brazil, Canada, France, Mexico, the UK and the US, the findings show that enrichment and wellbeing are key purchase drivers. Owners primarily seek products that provide mental stimulation (27%), help reduce stress or anxiety (25%) or encourage physical activity (14%).
Dogs go for chews…
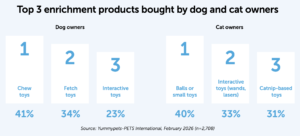
Chew toys are the preferred option for more than four in 10 dog owners (41%). This is followed by fetch toys such as balls and frisbees (34%) and interactive toys (23%). Puzzles or mind-stimulating products, as well as treat-dispensing toys, are also popular among dog parents, with a fifth (19%) of the respondents buying each of these.
Responses about which types of toy pet owners purchase are, in general, very similar in all seven countries. The exception to this is French dog owners, who appear to buy fewer enrichment toys from four of the five categories analyzed.
Other notable dog owner data focuses on toy type. Canadians are fonder of interactive toys (30%) and of puzzles and brain-stimulating objects (24%) than the average respondent. UK owners (26%) also buy significantly more puzzles than average and purchase more (24%) treat-dispensing toys, as do Australians (25%). At 14%, Mexicans buy treat dispensers less than average.
… while cats favor balls
Balls and small toys dominate preferences among cat parents (40%), followed by interactive items such as lasers and wands (33%) and catnip-based toys (31%). Cat owners also say they spend money on electronic or automated toys (17%) and puzzle feeders (13%).
Looking at the responses in all seven countries, the most interesting takeaway is that US owners buy the most enrichment products for their cats, and Mexicans are the least likely to purchase this type of toy. This applies to four out of five types of enrichment toys. Respondents from Australia, Brazil, Canada, France and the UK show similar purchasing behavior in all four categories.
There are differences when it comes to buying catnip-based toys. Here, the rates for Australian and Brazilian respondents are significantly lower than the average, at 21% and 25% respectively. Mexicans also show less interest in this category, at 22%. And while, on average, three in 10 cat parents buy toys like these, this purchasing rate rises considerably in the US – 45% of consumers respond positively there.
Purchasing frequency
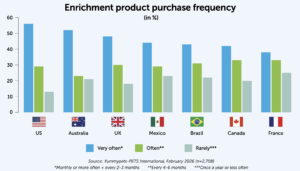
The number of frequent enrichment toy shoppers – or those who buy one every two to three months – is highest overall (33%), followed by occasional shoppers (every four to six months), at 30%. Then come those who buy something only once a year (14%), followed by consumers who, on the contrary, do so monthly or even more often (13%). Finally, 6% of respondents say they rarely buy enrichment products.
At first glance, the findings don’t seem to show many significant differences between different countries. But looking at purchases made often or very often (at least once in six months – an average of 76%) compared to purchases done much less often (once a year or rarely – an average of 20%), it’s the respondents from predominantly English-speaking countries who are most likely to buy more frequently than those from other countries.
Looking at the purchases within these larger categories, the more frequent buyers are in the US, at 85%, followed by the UK (78%). The other English- speaking countries Australia and Canada follow at 75%. Brazilian and Mexican respondents buy slightly less frequently (74% and 73%), and France has the lowest number of frequent shoppers at 71%.
What buyers are looking for
Cat and dog owners have different motivations for buying these products – some of them clearly linked to the differences in characters and living situations of the type of pet involved. For example, while 27% of cat parents opt for enrichment products to prevent their indoor pets getting bored, the same number of dog parents spend money to provide mental stimulation. Only 16% of the cat-owning respondents give this reason.
These contrasting cat and dog purchasing motivations can be observed in all categories. For instance, while improving independence when the pet is alone is a choice for 12% of dog parents, only 6% of cat parents buy for that reason. Similarly, 25% of dog owners seek to reduce stress or anxiety with these purchases, while this drops to 16% among cat owners.
On the other hand, stimulating physical exercise is the goal for 24% of cat parents, a rate that falls to 14% among dog parents. Owners of dogs give two other motivations for enrichment spending: reducing destructive behavior (11%) and providing training support (5%).
Contrasting priorities in the Americas
The research findings do indicate some regional trends. One example is preventing boredom for indoor cats, which is a bigger concern in North America (34% on average for the US and Canada) than in Latin America (20% on average for Brazil and Mexico).
The opposite is the case when owners want to reduce stress or anxiety in their pets, whether cats or dogs. Latin Americans are the most concerned (with an average of 31%), while North Americans and Australians are the least interested for this reason (15%).
European countries don’t follow any obvious patterns in their purchasing motivation. While pet owners in the UK are more than averagely keen to provide mental stimulation for both cats and dogs, French owners stand out for their above average interest in promoting physical exercise for their cats.
How much are they spending?
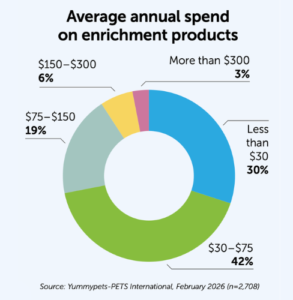
US pet owners are the biggest spenders, with 14% of buyers spending more than $150 (€130) on enrichment products in a year, compared with a 9% average. Overall, almost one fifth of the respondents (19%) fall within the upper-middle spending bracket – between $75 (€65) and $150 (€130). This spending amount is higher than average among Australians (26%).
The majority of the respondents spend within the lower-middle range – between $30 (€26) and $75 (€65) – an amount spent by over four in 10 (42%) owners and spread more or less evenly across the seven countries. And nearly a third of pet parents (30%) spend less than $30 (€26). This amount of spending is more frequent in France, at 36%.
Acceptable pricing levels
In terms of price per unit, 49% of pet parents consider between $11 (€9.5) and $25 (€21.5) the most acceptable price range for enrichment products. Led by Canadian and UK pet owners, another 21% think these products should cost even less, at under $10 (€9).
Looking at the higher ranges put to the respondents, just over a quarter of them (27%) are willing to pay more than $26 (€22), but the majority (67%) would prefer the price to be no higher than $35 (€30).
Outlook for the near future
Overall, one in five (21%) consumers expect to increase their spending on this pet care category over the next 12 months, while the majority (66%) say the amount they spend is likely to stay the same. Higher spending is expected, in particular, by Brazilian owners (33%), followed by Australians (26%).
The expectation is quite different in Canada and France, as respondents from these countries have the highest hopes of maintaining their current spending levels. Finally, only 4% of pet parents expect to spend less on these products, with an even distribution across the seven countries.
Rewarding innovation
A positive sign for the industry is that pet owners are inclined to support technological advances. When asked if they’re willing to pay more for innovative or ‘smart’ enrichment products, the majority answer that they are, divided between those who are definitely prepared to do so (17%) and those who would depending on the benefits (48%). Brazilian and Mexican responses are the most positive in this respect.
While a quarter (25%) of the respondents would perhaps consider spending more on an innovative product, especially in Canada and France, only 7% of all the respondents say they wouldn’t be willing to do so, with a stronger “no” given by French pet owners (15%).
The results of the survey show that enrichment toys serve different purposes for various kinds of pet owners. But there is, in general, always room in their annual budget for purchases, even among those who would like to pay less for a product.
Share this story:
One click prioritizes GlobalPETS in your search results and AI answers.