Chile pet market (II): supermarkets dominate pet care purchases, social media gains ground

Veterinarians, specialty stores and informal retail still play a significant role across categories.
Supermarkets and grocery stores are the preferred channel for Chilean pet owners to buy pet supplies, with nearly half (48%) buying food for their furry friends via this channel.
They are also the first choice for purchasing grooming products, treats and snacks, toys and accessories. Those looking for hygiene products, supplements, medicines and vitamins, on the other hand, tend to buy more from veterinary clinics or specialty pet stores.
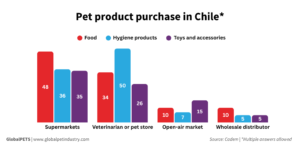
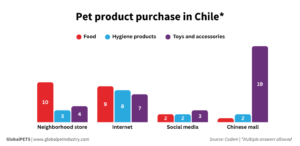
Although the 3 retail channels together account for more than 60% of purchases across all categories, other channels also appear among the habits of Chilean pet parents: open-air markets, wholesale distributors, neighborhood stores, the internet, social media and large discount stores run by Chinese merchants (particularly for toys and accessories).
Results come from a survey conducted by Chilean market research and public opinion company Cadem, which interviewed 1,381 adults nationwide in August 2025.
Read here for the first part of this coverage on pet population and spending trends.
The upper middle class drives online shopping
The survey shows that e-commerce is not yet the most popular purchasing channel for pet supplies, accounting for 5% to 10% of sales per category.
The report highlights differences in behavior between social classes.
In Chile, households are grouped into socioeconomic segments (ABC1, C2, C3, D and E) based on income, education and living conditions, with ABC1 representing higher-income households and D and E the lowest-income segments.
Pet owners in the ABC1 group (upper-middle class) buy almost twice as much food online (15%) as those in classes D and E (8%). Pet parents from class ABC1 also purchase food more frequently through veterinary and specialized clinics (52%) than those from classes D and E (26%). The report also found a generational difference in habits, with more respondents aged 18 to 34 relying on the internet (14%) and social media (3%) than those aged 35 to 54 (7% and 2%) and those over 55 (5% and 1%).
Dry food dominance
Dry food is the most frequently fed food, with 59% of respondents reporting that their pets consume it every day.
Wet food, homemade food cooked especially for pets or leftovers from household meals have a similar distribution: around 13% to 14% of owners opt for one of these every day, while 31% to 35% do so less frequently. However, wet food is given a little more often during the week (3 to 6 times) than the other two.
Biologically appropriate raw food (BARF) still has very low penetration, with 65% of pet owners never giving this option to their pets. Among those who do, the frequency is lower, with only 14% of respondents using it more than 3 times a week.
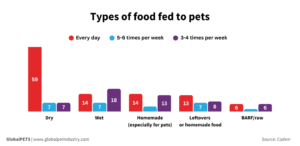
However, there is a difference between types of pets: while dogs eat more leftover homemade food (21%) than cats (16%), cats consume more wet food (24% vs 19%). The consumption of BARF and dry food is very similar.
Respondents still primarily trust their veterinarians (44%) to choose the healthiest type of food for their pets. And although they don’t use the internet as frequently for general shopping, pet owners rely on social media (40%) and websites (29%) to find information about food options.
Inflation and economic hardships
The research also investigated how pet owners reacted to inflation and the economic difficulties of recent years.
More than half of respondents (52%) said they have kept buying the same food; a quarter (25%) remained brand loyal, but changed the type of food, format or place of purchase; 17% traded down for a cheaper brand, and 4% switched type of food.
The report notes that “many owners report having adjusted their pets’ diets: buying larger sizes, switching to cheaper brands or reducing spending on snacks and accessories,” concluding that consumers have shifted their focus toward “more rationality and a search for convenience.”
Share this story:
One click prioritizes GlobalPETS in your search results and AI answers.